
How to use the Facebook Ads KPIs Spreadsheet Template
ABSTRACT: The Facebook Ads KPIs spreadsheet template was made by a great digital agency to help them communicate their cost and engagement KPIs to their client in a clear and concise way. The template provides an aggregate summary of all KPIs from Facebook spending channels (Facebook, Instagram, Messenger, etc) within a 14-day period.
The instructions below indicate a step-by-step guide to understanding this great Facebook Ads spreadsheet template and dashboard found here: https://factivate.com/automated-spreadsheet-template-marketplace/facebook-kpis-spreadsheet-dashboard-with-monthly-adset-reports/
If you would like to go directly to the blank spreadsheet template, you can do so by going to this link: https://app.factivate.com/spreadsheets/ceb90c22b6cf47dfbf738989b27c4c31. Note that if you do not have a Factivate account, you will not be able to use it correctly.
Connecting your Facebook Ads KPIs Spreadsheet Template to Facebook in less than 1 minute
Once you’ve copied and added the Facebook spreadsheet template to your account (FILE>DUPLICATE), you will notice that the entire spreadsheet has no data. This is because you have not connected to each of the Facebook data sources. To connect your template with Facebook, simply click on all of the blue tabs at the bottom: FBAdsAcct1 (pulls from Facebook Ads). If you don’t know how to enable the connections, you can view on connecting your spreadsheet to a third party source below:
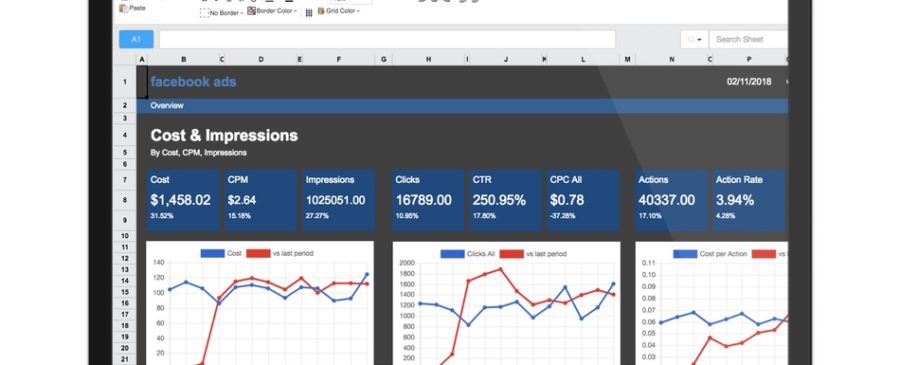
Understanding your Facebook Ads Dashboard
This elegant dashboard gives you a breakdown of cost-specific KPIs for all your paid Facebook ads activity. You see a week over week (WoW) overview of your Cost, Acquisition, and Action KPIs immediately followed by 3 specific charts showing your KPI trends over a 14 day period.
Below, you see a breakdown of your best performing campaigns (sorted by conversions) and top-level performance metrics. This dashboard is ideal for clients who want a quick overall view of their Facebook Ad spend and can be modified to suit your individual needs using nothing but spreadsheet formulas.
Understanding your Month-over-month Ad performances in tab titled KPIsMoM
This spreadsheet tab combines all of your Facebook Ad spend data with a month over month comparison. All of the formulas/KPIs revolve around the dates in “blue” text listed in the first two rows so if you would like a week over week comparison instead of month over month comparison, all you need to do is to edit the dates. FYI – date format must remain MM/DD/YYYY for it to function properly.
After your overall, performance, and engagement KPI metrics, you will see 3 charts that will display specific KPIs per Ad Set. For these charts to function, you will need to MANUALLY add the Ad Sets (or audiences) that you would like to compare starting in row 39 column B.
If you list all of your Facebook Ad Sets manually in these cells, you will also see the relevant KPIs to the right get calculated. Now you can compare the exact performance of these ad sets on a month over month view as well as their KPI trends on the charts above them. We call this tab the Batman tab because of it’s incredible versatility in campaign tracking. In fact, most agencies will Facebook to manage their creative but will quickly use this tab to manage the campaign analysis and insights.
Note that Charts are displaying the data listed after column AI. If you would like more detail on what’s showing up, simply scroll to that column.
Conclusion
This Facebook Ads KPIs Spreadsheet Template was built to help you aggregate and analyze your Facebook data automatically from one place. It combines all KPIs from Facebook’s different ad channels (Facebook Ads, Instagram Ads, Messenger Ads, etc) to give you an overall picture of your channel-specific performance. This template is incredibly useful to Facebook Ads specialists and we hope that it will help you be an even better marketer. Please email us at info@factivate.com if you have any questions or leave a comment below.
For additional Facebook templates built for marketers, please visit the Factivate Spreadsheet Template Marketplace