
How to Create a Great Facebook Spreadsheet Report that Impresses your Boss
It’s summer and we want you to go outside and enjoy the beautiful weather rather than be stuck writing some terrible Excel or Google Sheets report that will take up too much of your time. In keeping with our mission to make employee lives easier, we decided to provide you, our valuable readers, with a great guide on how to create a great Facebook spreadsheet template that will impress your boss and let you go out and enjoy the summer fun at the same time.
If you’re like me, you probably are ready to just view the damn thing rather than keep reading right? Well, here’s a link to the Factivate spreadsheet report that automatically reports on Facebook so that you don’t have to build it yourself.
Whenever someone talks about Social media reporting, specifically Facebook KPI reporting, some of the biggest mistakes people we see relate to individuals evaluating numerous data sets without really understanding the customer journey. Reach, clicks, views, relevance score are typical KPIs that a majority of agencies will use yet even though they don’t actually derive insights from any of them. This is why we often cringe when we see that a digital marketer pays for a dashboard tool (hm hm Shableau), that tends to feature these KPIs in the initial views.
Taken this into consideration, we will help you put together a automated spreadsheet report that pulls information from Facebook and Instagram where each KPI can be analyzed and used to derive specific insights and help you optimize your Facebook leads campaigns while making you look damn good to your boss (so much so that he or she will think you’re working non-stop to keep it up).
Setting your Baseline Assumptions
Every marketer I know always begins with targets to compare their campaign performances with their goals. This spreadsheet should take that into consideration. Below is an example of what your baseline assumptions could be tracking if you have either leads or conversions as your Facebook campaign goals:
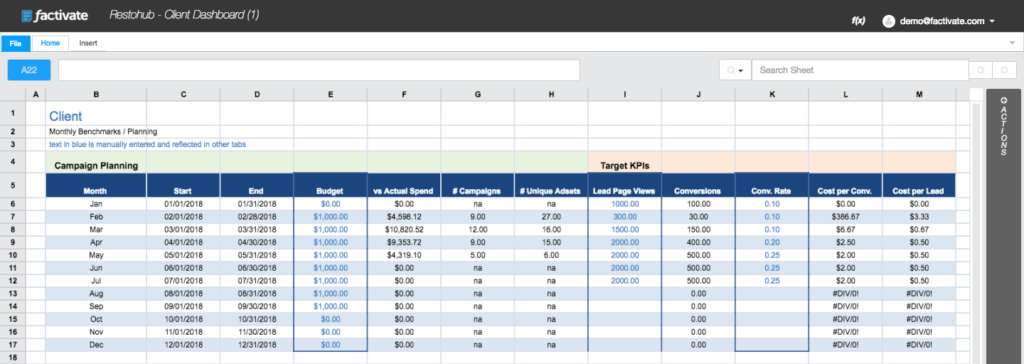
Use this tab as your starting point. In here, you can plan by month (as listed) or by week. Be sure to include a different in text color to display what is manually entered (assumed) vs what was achieved). This tab is extremely useful for setting baselines each month for your campaigns. Regardless of your goals, I highly recommend having something like this in your spreadsheet that tracks performance over an extended period of time.
Once Planning is done, Track the Facebook KPIs that really matter
Each Facebook campaign is tied to a specific objective and the spreadsheet we’re creating will help you track your goals vis a vis the objective.
For Lead Generation Campaigns
Lead generation campaigns require you to have a sound Campaign Builder (UTM tracker) library to help you track your leads beyond Facebook. If you do not know how to do this, we created a great article to help you (https://blog.factivate.com/the-best-guide-to-utm-campaign-tagging-for-digital-marketers/).
Once you’ve got a great UTM library setup, here are the important metrics for any campaigns that are driving traffic to any kind of sign-up page:
- Impression: the total number of times your ad was shown. This is different from reach, which is the individual number of people who have seen your ad.
- Cost per 1,000 impressions (CPM): The average cost to show your add 1,000 times. This price varies depending on the demand for the audience you’re targeting at the time you run your ads. Note that many people don’t run ads based on CPM as interaction rates depend on supply and demand at the time. Furthermore, if you’re not tracking your customer click journey from the ad correctly, you can be mislead by some of the CPM data.
- Frequency: the average number of times an individual has seen your add calculated by impressions divided by reach. This is an important metrics to pay attention to as it has a direct effect on your ad’s fatigue rate. I would recommend to keep frequency under 4 for ads shown in the news feed and under 6 for ads shown in the right sidebar.
- CTR (click-through-rate) Links: the percent of people who saw your ad and clicked over to your opt-in page. Also can be calculated by taking the number of link clicks and dividing it up by impressions.
- Ad Fatigue Rate: calculated by the change in CTR and the change in frequency on a daily basis. Facebook doesn’t provide this number but you can use it to calculate your Ad Fatigue ratios over an extended period of time. Then you’ll be able to see when certain ads have plateaued.
- Entrances into your Signup page: from Google analytics and your UTM parameters, you will want to track how many entrances came from a specific UTM Campaign based on your campaign URL to compare it to your Facebook Leads data (explained below).
- Conversions on your Signup page: from Google analytics and your UTM parameters, you will want to track how many goal completions took place from the specific UTM Campaign based on your campaign URL to compare it to your Facebook data (explained below).
- Leads: the number of people who signed up on your landing page after clicking on your Facebook ad. (note that you will need to set up conversion tracking pixel)
- Cost per Lead: how much each sign-up has cost you so far. Calculated by taking the amount spent and dividing it by the number of leads. This is why it’s important to track the difference between a Facebook reported lead and a Google Analytics reported lead.
What to do with the Data
Cost per Lead is your most important metric and you need to derive specific insights into the variables that will play a role in optimizing that number. I try not to pay more than $3.00 per lead because I understand my conversion rates very well. If I my cost per lead is too high, then I use these numbers to figure out why:
- Divide Link Clicks by Leads to understand my Landing page’s conversion rate. Then I compare it to my Google reported numbers. If my conversion rates are below 30%, then I try to think of things I can do to improve them.
- If my CTR number is below 1%, then the ad creative isn’t compelling or I’m targeting the wrong audience.
- If CPM is too high, then try a different audience.
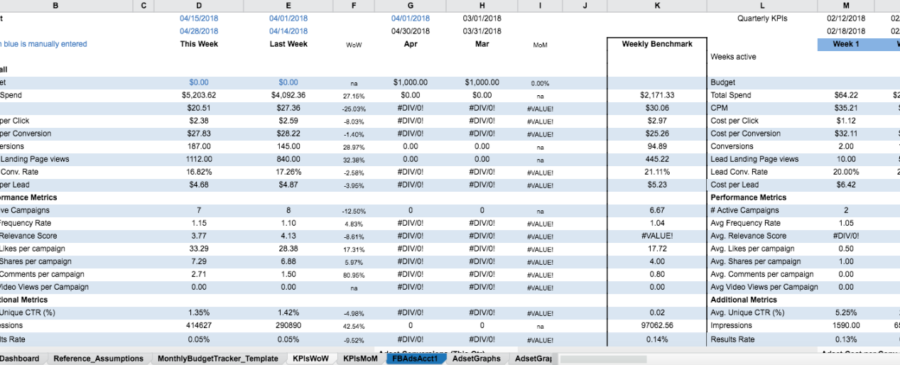
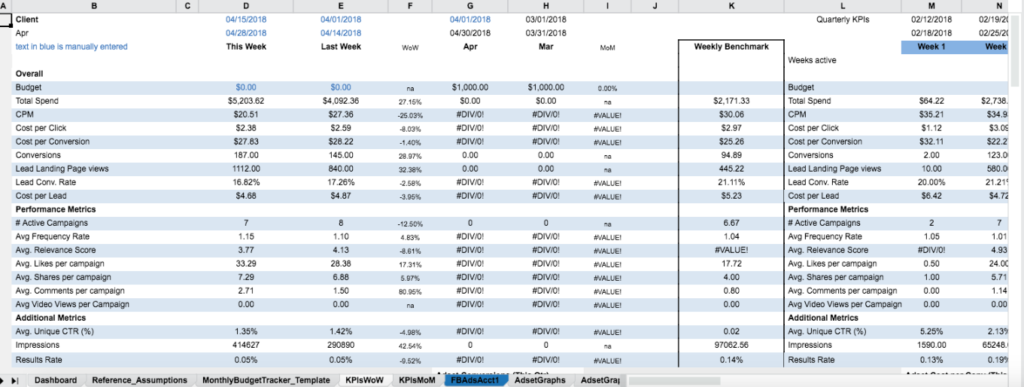
Here’s what a finished spreadsheet could look like for you:
Top level campaign views:
with a section underneath that tracks results per adset:
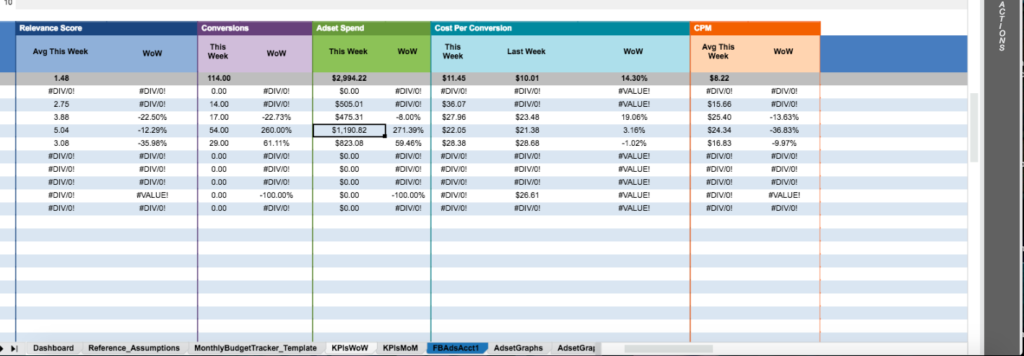
Note the heavy emphasis on a Cost per Conversion or cost per lead in both of the sections of the spreadsheet.
Also look at the weekly benchmarks (column K) of the spreadsheet. These numbers should be revised continuously as you get better and better about your campaigns and your insights abilities.
What am I missing? Are there any KPIs you track that you’d like to see? Let me know in the comments below!