
How to Use the Marketer Analytics KPI Spreadsheet Template Dashboard and Report
ABSTRACT: This Marketing analytics KPIs spreadsheet spreadsheet template provides digital marketers with a beautiful, fully automated, Marketing Analytics Dashboard and a Monthly Analysis Report that tracks all of your digital marketing KPIs from Google Analytics, Facebook, and Instagram in one place. You also get a 12 month data KPI report tracker so you can benchmark and review your KPIs (progress) for a 12 month period.
This great marketing spreadsheet template has automated reporting for entire organizations instantly while helping them focus on insights and campaign optimization. The instructions below indicate a step-by-step guide to understanding this versatile template and dashboard found here: https://factivate.com/automated-spreadsheet-template-marketplace/facebook-instagram-google-analytics-kpis-spreadsheet/
Prior to getting this file, make sure you’ve been able to review the public view of the template and copy it (FILE > DUPLICATE) into your own Factivate account. The public view of the blank Marketing Analytics KPIs spreadsheet template titled “Facebook, Instagram, Google Analytics KPIs Template” can also be found here: https://app.factivate.com/spreadsheets/d877c75955864a23aadfe3479d785483
How to connect your Marketing Analytics KPIs Spreadsheet Template to pull data from Facebook, Instagram, and Google Analytics in less than 2 minutes
Once you have copied and added the template to your account (FILE>Duplicate), you will notice that the dashboard and the monthly report spreadsheet tabs are essentially blank with zeroes and errors. This is normal because because you have not connected your spreadsheet to the Google or Facebook Data sources.
To connect your template to your accounts, you will need to go to each “Blue” tab (FBAdsAcct1, FBPostsAcct1, FBPageAcct1, GA…) and connect each one to start pulling in your data. If you need help figuring out how to connect your spreadsheet to each account, see the guide below:
Understanding the Monthly Report Tab titled “MonthlyAnalystReport”
This report tab is a digital marketer’s dream. Not only is it filled out automatically but you can alter the dates to compare different time periods. By default, the template is comparing two different months but you can easily alter the dates to show a week over week comparison.
NOTE: only data in blue is manually entered. Everything else in black font is a calculated value
The report demonstrates KPIs for acquisition, engagement and outcome and you should think of this spreadsheet in three sections.
First, we start off with total traffic and total leads from that traffic. This data comes from Google Analytics and requires your Analytics Goal Completions to be set up.
Immediately after these inbound traffic KPIs, we break down the conversions per source of traffic. In this section, we see a mix of Google Analytics reported data and Facebook reported data (look at rows 26 to 29). This Facebook data is reported by Facebook as an Offsite conversion. We include this comparison because many marketers are stunned when they realize the data disparities between Facebook reported and Google reported numbers. When you notice this data discrepancy consider the attribution and pixel settings to figure out why Facebook is over-reporting your conversion numbers (as is typically the case)
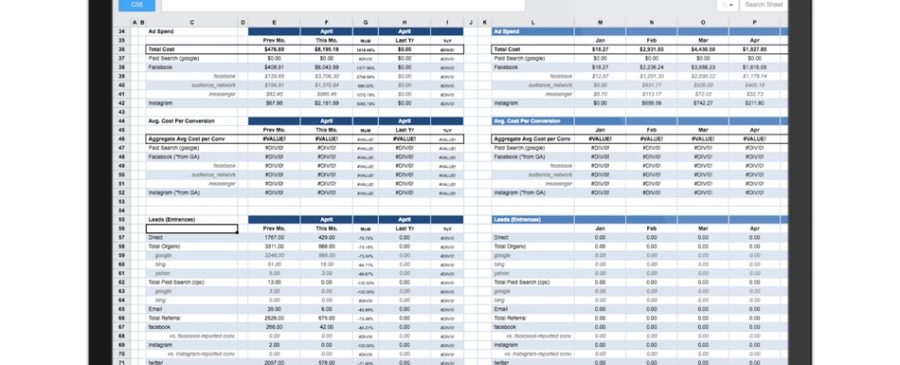
Secondly, we include your Ad Spend numbers per platform (rows 34 to 52). Consider the average costs per conversion to determine where your best ROI will come from. The cost per conversions are using GA as the source of truth for your conversions and not the Facebook reported conversions.
Finally, we provide a breakdown of all leads generated per channel. These leads are reported by Google Analytics as visitor Entrances into your site. We also include the Facebook-reported leads so you can compare for data discrepancies.
As you move across, you will notice that the tab includes a 12 month outlook for these data points to help you spot seasonality and conversion trends. You can also continue to add specific KPIS below the Leads section by simply writing and referencing the connected tabs.
Understanding the Facebook Dashboard monthly view titled FBDashboardMOM
Use this view for a month-over-month comparison on your PAID Facebook and Instagram activities. The dashboard is broken down into two sections.
First, we begin with the typical ad performance top-level kpis: spend, impressions, likes, comments, shares, CTR for each channel (facebook and instagram). The second section (starting with CONVERSION FUNNEL and ENGAGEMENT should give marketers to real numbers to calculate their own ROI and compare to benchmarks. We particularly find it useful to look at the ENGAGEMENT KPIS (avg likes per ad, avg shares per ad, and avg comments per ad) to establish company benchmarks for average ad performance. When we have those, this dashboard helps us see if our ads managers are staying on top of their ads or not.
Finally, the dashboard view provides a Campaign Notes section where the ads managers and directors can collaborate and add notes on the active campaigns (ie, which one did best, which ad set is currently being tested, and finally, what was the business impact of our overall strategy for the month.
Understanding the UTM Library spreadsheet tab
This Campaign URL Builder and UTM library spreadsheet tab was built to help you build and track your campaign KPIs in one place. It’s important to understand the best practices that go into a solid UTM campaign strategy. For more information on the underlying platforms that make this wonderful tab the most useful UTM spreadsheet for digital marketers, please visit: https://blog.factivate.com/the-best-guide-to-utm-campaign-tagging-for-digital-marketers/
Conclusion:
The Marketer Analytics KPI Spreadsheet Template was built to help you aggregate and analyze your Google Analytics website, Facebook, and Instagram data from one place automatically. We hope the template helps you become a great digital marketer with just a few clicks. Please email us at info@factivate.com if you have any questions or leave a comment below.
For additional Facebook templates built for marketers, please visit the Factivate Spreadsheet Template Marketplace