
How to Use the Best Facebook KPIs Spreadsheet Report and Dashboard Template
ABSTRACT: This Facebook KPIs spreadsheet report and dashboard template for digital advertisers and marketers provides marketers with an automated solution to help them monitor Facebook-specific paid and organic activity. View your engagement, community, and spend metrics in one place by using Factivate’s intelligence engine. The instructions below indicate a step-by-step guide to understanding this amazing Facebook spreadsheet template and dashboard found here: https://factivate.com/automated-spreadsheet-template-marketplace/facebook-spreadsheet-kpis-template-with-dashboard/
Prior to getting this file, make sure you’ve been able to review the public view of the template and copy it (FILE > DUPLICATE) into your own Factivate account. The public view of the blank Facebook KPIs spreadsheet template can be found here: https://app.factivate.com/spreadsheets/f2a3990fc2684d04920094116bfb61f7
Connecting your Facebook KPIs Spreadsheet template to automatically pull data from Facebook Ads and Facebook Insights
Once you’ve copied and added the Facebook spreadsheet template to your account (FILE>DUPLICATE), you will notice that the entire spreadsheet has no data. This is because you have not connected to each of the Facebook data sources. To connect your template with Facebook, simply click on all of the blue tabs at the bottom: FBAdsAcct1 (pulls from Facebook Ads), FBPageAcct1 (pulls Facebook posts info), and FBPageAcct1 (pulls fan-specific data). If you don’t know how to enable the connections, you can view on connecting your spreadsheet to a third party source below:
Understanding your Facebook Ads Dashboard tab within your Facebook KPIs spreadsheet
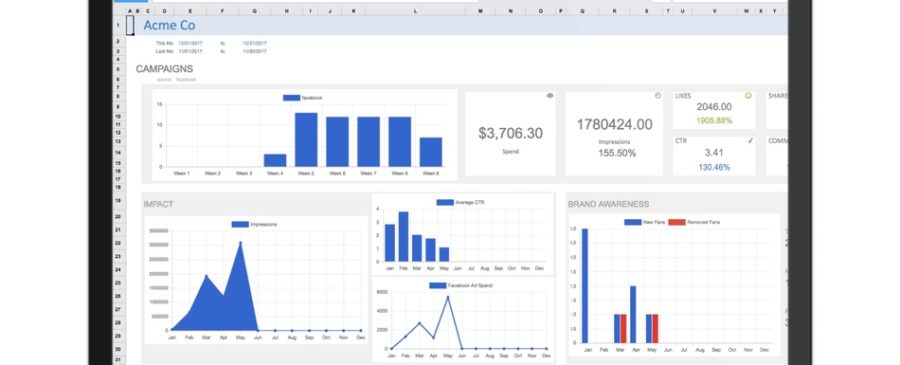
This dashboard view was constructed to pull only Facebook-specific KPIs from your paid Ads efforts in a month-over-month view. All of the KPIs reported will exclude data from Instagram, Messenger, and Other Networks used through Facebook Ads Manager.
The Facebook Ads Dashboard first displays the top-level KPIs: spend, impressions, likes, comments, shares, and CTR in a month-over-month view. The second section digs deeper into Engagement KPIs for the entire account. It’s important to note that the dashboard provides the average likes per ad, average shares per ad, and average comments per ad to help you establish a benchmark within your organization and ensure that you’re optimizing to exceed that benchmark continuously.
Finally, the dashboard provides a Campaign Notes section where any user (manager, director, client) can collaborate in providing insights and recommendations for campaigns during the month.
Understanding the Week-over-Week Facebook Ads tab titled Client1RepWoW
This spreadsheet tab is incredibly useful for marketing teams and analysts because it automatically pulls all of your data from paid ads campaigns for Facebook Ads. The tab is broken down into three main parts:
At the top, it provides a section that every analyst should be filling out: what were our campaign insights, our recommendations, and the business impact of those recommendations. You should ensure that this section is always filled out prior to sharing this data with anyone else or discussing new marketing strategies. It provides context and insights that help other individuals understand results “beyond the numbers”. Next to it, you will find top-level campaign KPIs for the Facebook Ads channel.
In the middle of the report, you will find the top 5 best ads published by engagement (shares, likes, and comments) in the past 14 days. We always find that the top campaigns sorted by User Comments always provide valuable “golden nuggets” of information once we start diving into the comments for substance, demographics, and personas.
Finally, you will find the Ad campaign KPIs (this is our analysts’ favorite section) sorted by Ad Spend in the last 14 days. The list is sorted by number of UNIQUE Ad Names published. NOTE: if you have ad names that are the same and fall under different ad sets, be sure to change them or your data will be skewed.
If you continue scrolling down, then you will find the Ad Campaigns KPI’s starting on cell C103. Look at the relevance score, frequency, CTR for each ad to understand whether it’s speaking to your particular audience or if it’s being displayed too much. Look through all of the possible KPIs listed to better understand your Ad’s performances.
NOTE, you can filter the Ad name list by Campaign Name, Ad Name, or Objective if you desire. Simply enter the filters in cells F99, G99, or H99 for Facebook. Trust me, this tool will quickly become your best friend. All of your data should re-calculate even if it takes a few minutes.
Understanding your Facebook Posts KPIs in the Week-over-Week tab titled: Clien1FBPost
This was one of the most requested reports we’ve ever experienced – “please automatically pull all of my posts, with specific kpis per post, in one place to save me from hours worth of copy/paste from different places.
Posts are sorted by engaged users (not by date) from high to low and the list is set to display 99 posts MAX. We find that analyzing more than 100 posts per 14 days can be overwhelming for some people but you are free to change this number. If you would like more or less posts displayed, go to cell D29 and edit the formula
=LARGE(DS(FBPostsAcct1!’Post Description’:’Post Description’,AND([@Post Date]>=$M$2,[@Post Date]<=$O$1),[@Post Engaged Users]),99)
All you have to do is change the number 99 to whatever number you wish. So if you want 50 posts listed, your formula would read:
=LARGE(DS(FBPostsAcct1!’Post Description’:’Post Description’,AND([@Post Date]>=$M$2,[@Post Date]<=$O$1),[@Post Engaged Users]),50)
There are a few calculated metrics that you should note which Facebook does not provide; this includes CTR. This is a calculated metric that looks at Link clicks, photo views, and video clicks as variables for its formula since these link click types are directly correlated to engagement.
Conclusion
The Facebook KPIs spreadsheet template with reports and a beautiful dashboard was built to help you aggregate and analyze your Facebook data automatically from one place. We hope the template helps you become a great Facebook marketer instantaneously. Please email us at info@factivate.com if you have any questions or leave a comment below.
For additional Facebook templates built for marketers, please visit the Factivate Spreadsheet Template Marketplace