
The 7 Best Facebook Spreadsheet Reports and Dashboards of all Time
As a data junkie, I’ve been inundated with requests for additional Facebook-specific report spreadsheet templates for digital marketers. Requests like: “Whats the best Facebook KPI report you’ve ever used?” or “How do I stop wasting time generating Facebook reports?” are common themes with many of our clients. This is why we wanted to list the 7 best Facebook KPI reporting spreadsheets and dashboards of all time!
Whether you are seeking a report that will aggregate 200 Facebook accounts (yep, one of our customers uses one!) or a Facebook Ads report with different tabs custom-made for each team leader because they all look at data differently (this is also very common), it seems that getting started with a coherent Facebook analysis strategy can be pretty overwhelming for a lot of people. Never fear, the Factivate data junkies are on it!
We’ve compiled some of the most popular Facebook KPI spreadsheet reports and dashboards that automatically import Facebook information after scouring the web for hundreds of hours, working with Facebook experts, and ultimately partnering with some of the best digital marketers who want to improve on their Facebook ROI.
Below is a list of the top Facebook Report spreadsheet templates that can automatically pull Facebook data without requiring you to write any code or complex queries. They’re listed in no particular order.
Top 7 Facebook Spreadsheet Reports and Dashboards of all Time
1) Dashboard & Spreadsheet for One Brand’s Facebook Page and Post activity-
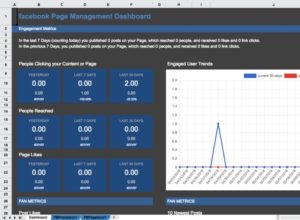
Description: This Facebook report with dashboard provides an overview of your Brand’s Facebook engagement and fan metrics. The dashboard provides a great window into your day to day, week to week, and month to month changes for specific key performance indicators (KPIs) brands are likely to track.
Spreadsheet link: https://app.factivate.com/spreadsheets/729ad2deb15443b6be70874436176d14
PROS: The Dashboard is incredibly easy to understand with a manageable number of KPIs for anyone to view and track. The use of daily, weekly, and monthly data trackers is great to ensure the entire account is going in the right directly. I love that we can see specific post KPIs (reach, fans, impressions, likes, comments, shares) per day so that you can determine what day performed best.
CONS: Just as the spreadsheet is easy to understand, the positive and negative feedback totals located in columns X and Y could be better featured even though I understand why they are located there.
CONCLUSION: This dashboard is great for agency clients who want a live dashboard to a Brand’s organic activity and community growth strategies. The fact that everything is in one tab makes your KPIs easy to find without having to click through multiple pages.
2) Dashboard & Spreadsheet reports for multiple brand Facebook Pages (10+)
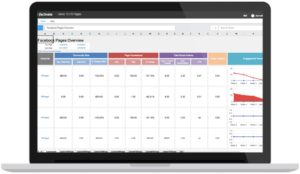 Description: This Facebook Dashboard and Spreadsheet is great for organizations wanting to track multiple Facebook profiles/pages in one place. The template starts with 10 Facebook pages that are being tracked but, because it’s a spreadsheet, you can add as many as you wish. The addition of individual page reports per brand/Facebook page is a great addition for those wanting to report page/post performance to specific brand managers or clients.
Spreadsheet Link: https://app.factivate.com/spreadsheets/3c7a0e27f0fe41b49837f0be63bfc125
PROS: You can track as many Facebook accounts as possible without having to pay per page or account! (unlike other dashboard tools). Brand managers will really like the Executive Dashboard because it can be as customizable as you need it (only needs spreadsheet formulas!). I love the fact that there are individual Facebook page and post spreadsheet report templates which I can decide to share with a client or account manager. These reports can save us an incredible amount of time. The individual reports can display all of my posts in a period of time (I choose weekly) plus campaign notes.
CONS: It’s hard to find a problem with this template for someone who has to manage multiple accounts/report. The fact that I can alter this report with a simple spreadsheet formula gives me the flexibility I need if I want to report on a calculated KPI.
CONCLUSION: Facebook brand managers will love this automated spreadsheet report to track multiple Facebook pages. Not only is this spreadsheet template a thousand times more useful than the analytics Facebook provides but it’s also a lot more flexible in terms of reporting and tracking your Facebook organic page and post activity. We love that there’s no limit to how many accounts you can manage from one place and that you can manage view/share permissions per tab.
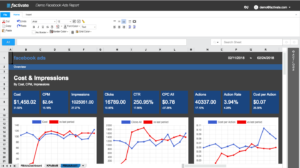
3) Facebook Ads, Page, and Posts Spreadsheet KPI reports with Client Dashboard
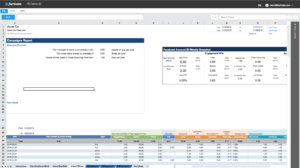
Description: This Facebook spreadsheet template gives users a great overview of their Facebook paid and organic data. You get a Client dashboard for your Facebook ads, a weekly report for your Facebook ads, and a Facebook Page and Post weekly report template.
Spreadsheet link: https://app.factivate.com/spreadsheets/f2a3990fc2684d04920094116bfb61f7
PROS: This template is all about Facebook analysis and reporting flexibility. Managers will love that they can share a dashboard with their VPs or clients. Account managers will love the weekly tracking tabs (for ads and posts) so that they can focus on optimizing their strategy without waiting for a report to be created. We’re big fans that the weekly Facebook ads template includes a section where the account manager or analyst can add a Campaign report with Insights, Recommendations, and Business Impact sections.
CONS: The report provides an extensive breakdown of KPIs for Ads and Posts. In the Weekly Ads report template, the individual campaign report KPIs are located in row 97 and you will need to scroll down to view it. I understand you cannot fit all the information in the screen but note that this is not readily viewable and you will need to scroll down.
CONCLUSION: Need a place to track all of your Facebook Ads and Organic KPIs? This spreadsheet template will likely give you all you need and more! Each Facebook Campaign and Post will be automatically reported on with a number of success KPIs you need to track and analyze continuously. This template will surely make you a great Facebook specialist.
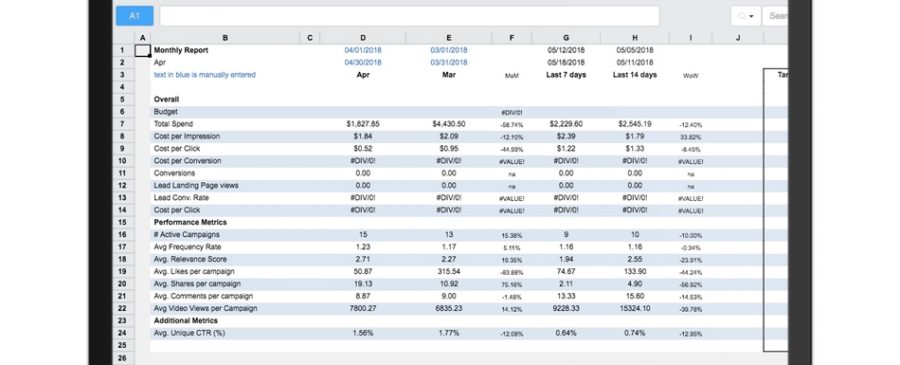
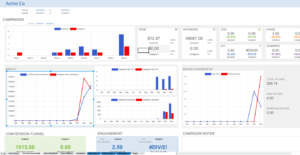
4) Facebook Ads KPIs spreadsheet with Executive Dashboard
Description: This Facebook KPIs spreadsheet provides you with 2 tabs (1 that acts as a dashboard and the second acts as data tracker for your Facebook Ad sets). The dashboard view gives you some top level Ad spend KPIs and the KPIs month-over-month tab provides you with a great way to track all of your important Ads KPIs.
Spreadsheet link: https://app.factivate.com/spreadsheets/ceb90c22b6cf47dfbf738989b27c4c31
PROS: Digital agency clients love this type of dashboard that breaks down the top three metrics (cost, impressions, engagement in one place). You get a week over week view of all your Facebook Ads account metrics as well as your best performing campaigns in one place. The real money on the template, however, is in it’s intuitive and beautiful monthly reporting tab for Facebook Ad sets. We love you can view a MoM and week over week view of all of your Facebook Ads metrics. Furthermore, we can list any Facebook Ad sets we want to monitor, starting in row B9, and get all of the comparison metrics that lead us to optimize our Ad sets.
CONS: Most people sometimes ask for KPIs per Campaign, then per Ad set, then per Ad. This is not the template to inundate you with data. Some users have asked to pull all of the Ad Sets automatically. While this is possible with a simple formula (like the formula below), the template’s default is to have a user enter the Ad Sets manually.
UNIQUE(DS(FBAdsAcct1!’Adset Name’:Adset Name’, AND([@Feed Timestamp]>=D1,[@Feed Timestamp]<=D2))
CONCLUSION: The Facebook Ads KPIs and AdSet Spreadsheet report and dashboard can be a valuable addition to your Facebook campaign/strategy optimization efforts. The combination of dashboard and monthly report will solve the need for 90% of Facebook marketers out there.
5) Facebook and Instagram Ads, Page, and Post KPI Spreadsheet template with Dashboard
 Description: This Facebook and Instagram KPIs spreadsheet combines a dashboard, monthly, and weekly ad reports for organizations to track and analyze all of their Facebook paid and organic activities from one place. The various tabs will help managers, analysts, clients, and executives get their unique perspectives from the same data points.
Spreadsheet link: https://app.factivate.com/spreadsheets/6357f52469424cc5b0f7c24b41442426
PROS: Daily, weekly, monthly, and yearly data comprise this great Facebook reporting spreadsheet. This was truly meant for any great marketer wanting to get a hold of their Instagram and Facebook activities. We find that each tab can be uniquely suited for any team member (from executive to analyst). We especially love the fact that we can split all of our individual channel KPIs per tab.
CONS: This is a great Facebook and Instagram spreadsheet template, however, the Facebook data is filtered to ONLY show Facebook Ads from the Facebook platform (meaning messenger and other network channels) are not included in the reporting. To combine the three, you need to alter a few formulas but it’s entirely doable.
CONCLUSION: Bring this template to your social media marketing team and you will be your organization’s hero very quickly. The multiple tabs and dashboard view provide a great alternative to the tedious tasks of manual reports and flipping from dashboard to dashboard tools.
6) Marketing Analytics Report and Dashboard with Facebook, Instagram, and Google Analytics integration
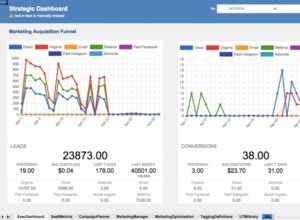 Description: Want to track your real traffic leads and conversion from your Facebook and Instagram channels into your website? This dashboard and spreadsheet report does exactly what you need and more. View your data in context, view all of your traffic KPIs, and even learn about potential data discrepancies between your Facebook-reported conversions and Google-reported conversions.
Spreadsheet link: https://app.factivate.com/spreadsheets/bd606a877ac046548fd807ecf5722e9d
PROS: This template was built for a marketing organization to be able to track, analyze, and automatically build reports beyond one channel. We love how the Google Analytics data is viewed in context of the Facebook paid performance data. This is a real plus for the template! Tab were carefully thought out for each individual in a marketing team from a Campaign Planner to a web analyst and marketing manager. The executive dashboard provides a great window into the entire digital organization KPIs and the UTM campaign creator is a great addition! This template is a must for any organization.
CONS: The Marketing Optimization tab provides a single place where you can track your UTM campaigns and compare/contrast the results with Facebook reported data (ie, Facebook spend or Facebook-reported conversions). The list appears automatically and is listed by Ad Sets. However, you MUST MAKE SURE that your adset names are unique (meaning you don’t repeat them across campaigns). Repeating ad set names will skew your data.
CONCLUSION: This template provides a great window into the amazing reporting and analysis that Factivate can do for organizations. Every marketer has wished for all of their reporting to be automated and in their spreadsheets. This template solves these issues and will keep your organization running smoothly. Try it out! We highly recommend it!
7) Facebook Ads Campaign Builder and Tracker – pulls Facebook Ads and Google Analytics to report on UTM campaign KPIs and Spend
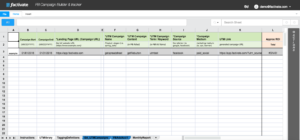 Description: If you’re an ads manager or campaign manager and you don’t already have a report for all of your UTM campaigns, you better get this FAST or risk loosing your job or clients. This spreadsheet template helps you build your own Campaign (UTM) URL links and track your campaign results in the same place.
Spreadsheet link: https://app.factivate.com/spreadsheets/75c8ee7791b141b08f987cb39738db4a
PROS: No more switching between websites to build UTM campaigns. Tracking UTM Campaign results from Adwords, Facebook, and Instagram is now completely automatic! Is there anything better for a marketer? This amazing template has all you need to stay on top of your UTM campaigns from one place. It’s amazingly useful when you’ve run a number of campaigns (in some cases over 100) and want to compare results across all 100 to see which one has performed best. It combines Google Analytics data with Facebook/Instagram data.
CONS: Entering your Campaign URL (UTM) parameters requires you to avoid a few things such as spaces and symbols like “+” or “/”. They template explains that this will mess up your UTM link so be sure to simply stay away from these things when you’re adding your campaign name…etc parameters and you’ll be great. The only other bummer of this template is that it’s only connected to Facebook and Instagram for now.
CONCLUSION: If you currently run any sort of UTM campaigns, this spreadsheet is now your new best friend. Not only will it save you hundreds of hours but will help you be an even better marketer almost instantly. Make sure you share this template with your entire team and ensure that they’re using it every single time you’re pushing any paid campaigns through any channel.
Do you have any comments on these templates? Maybe you want to track a particular KPI? Do you have any great automated or manually updated Facebook Spreadsheets that you’d like to share with us? Please write it on the comments below or send us an email at info@factivate.com so that we can share them with the rest of our marketing analytics readers!