The Top Instagram Ads KPIs Spreadsheet to Optimize your Ad Campaigns

Have you been publishing Ads in Instagram while a little voice deep inside you keeps thinking that you could be doing better? We ask ourselves that question every day! Recently, I went to a social media conference where I was asked specifically about leveraging data to optimize Instagram Ads and increase our ROI. I was surprised by how many people were intrigued by my answer(s) so I’ve decided to share some of my insights/ data practices here to help you generate better results (and make more money!) In the following post, we will discuss how to focus on 5 key performance indicators that impact your return on Instagram Ads campaigns. We also share which metrics you need to track as you experiment for optimum campaign status. We’ve even included an Instagram Ads KPI Spreadsheet template for you to help you take the plunge into Instagram insights nirvana.
If you’re already an Instagram Ads guru and are just here to get our awesome Instagram Ads spreadsheet template, simply click on the link below: Take me to my Instagram Spreadsheet report gosh darn it!
Still with me? Great!
Let’s get started with some conversion numbers so that you don’t think I’m full of it. According to Shopify, Instagram posts had a 1.08% conversion rate in 2017. Compare that to Twitter (0.77%) and Pinterest (0.54%), and you’ll see why we’re so bullish on Instagram today. There are many reasons why you should be advertising on Instagram, from high effectiveness to millions of users. We simply say, Instagram is one of the most efficient marketing channels for us.
As Instagram leverages the Facebook platform, it continues to evolve regularly to provide amazing user experiences. The fact that it evolves at such a rapid pace has meant three important things to us advertisers:
- Instagram adds new features that let us (advertisers) better connect with our audiences
- The platform is becoming increasingly beloved by its users.
- Instagram’s growth continues it’s amazing progress.
Due to these three reasons, I believe Instagram is the best channel for testing innovative ideas.
I know Instagram is Great, I Just want to be Amazing at it.
Instagram Ads KPI Spreadsheet and Focusing on Optimization
Once you’ve published your first campaigns, you quickly go to Facebook Ads Manager to track your data. Immediately you see a very beautiful layout of (what I call) a data puke. You see reach, cost, CTR, reach, amount spent, blah blah blah. You can sort your results by dates, objectives, and get further detail on your campaigns. But, where are your insights? How can you learn from a campaign?
Let’s start with the top 5 KPIs you need to understand to find your GOLD!
- Instagram Ads Relevance Score
- The relevance score is a number from 1-10 that Facebook calculates to help you understand how your audience is reacting to a particular ad. The metrics is calculated based on three variables:
- Is the ad bringing the conversions you optimized for?
- Is the ad generating positive people from people who see your ad – ie, app installs, clicks video views, etc…
- Is the ad garnering negative feedback – ie people clicking “I don’t want to see this” on your ads
- Relevance score benchmarks:
- Low: A relevance score of 1 to 3 points indicates that your ads are sucky in speaking to their target audience.
- Medium: A score between 4-6 is ok. You still are speaking to your target audience and you should try improving your ad design and copywrite (or even target a different audience)
- Good: a relevance score of 6+ is where you want to be. This score can help you significantly lower your advertising costs as Facebook will prefer them to other competing ads, delivering your ads to a wider audience.
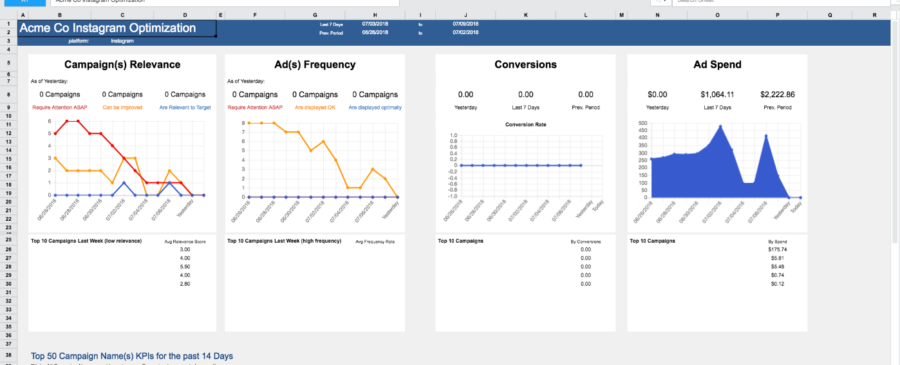
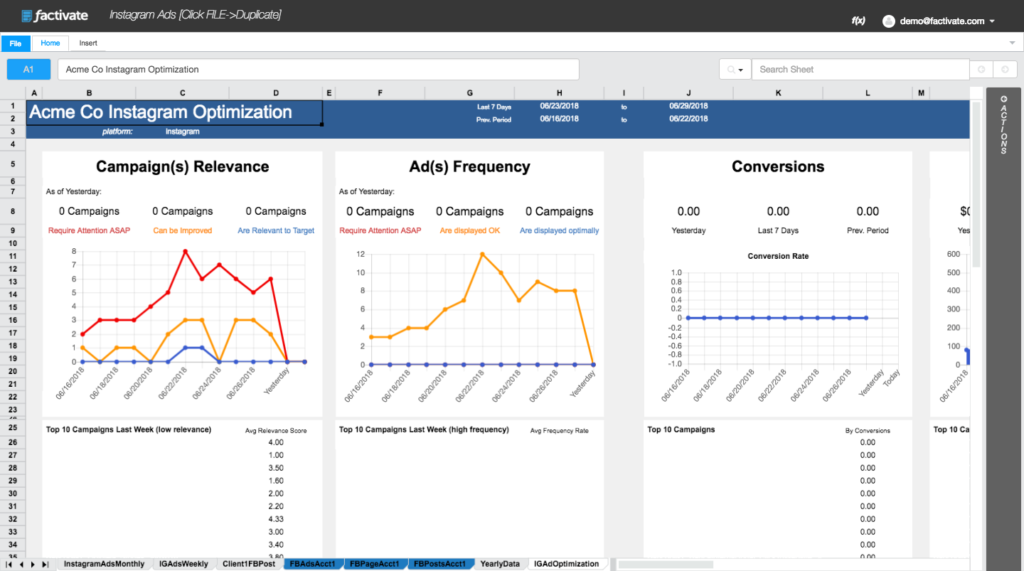
- Tracking Relevance Score: You can track relevance score by going into Ads Manager and viewing the Relevance score per campaign. In our case, we built a spreadsheet that tracks it for us. Below is an example of what that spreadsheet looks like to illustrate the point. Note, we’re always tracking the latest relevance score (ie, Chart data as of Yesterday) as well as weekly averages (list of Campaigns below chart).
- The relevance score is a number from 1-10 that Facebook calculates to help you understand how your audience is reacting to a particular ad. The metrics is calculated based on three variables:

- Instagram Ads Frequency
- Frequency displays how many times an audience member has seen your ad.
- Frequency Rate Benchmarks
- Bad: If your ad frequency reaches over 4 points, then it means most audience members have seen your ad for multiple times and are likely bored with it (ie, you should replace it asap with something new)
- OK: A frequency rate below 1 point means that not enough people are seeing your ad
- Good: A frequency rate between 2-3 is optimal for campaign performance for many of our use cases.
- Note that if you’re working with Facebook remarketing campaigns, you can also let your ad frequency go higher.
- Number of Conversions
- Before you take a look at other Instagram metrics, you should consider taking a look at the number of ad impressions and conversions (this is the case for whenever a campaign objective is focused on conversions)
- TIP: If there is an ad that’s performing really well in terms of CPC and conversion rate but only brought in a few conversions, it might not be a good performing ad.
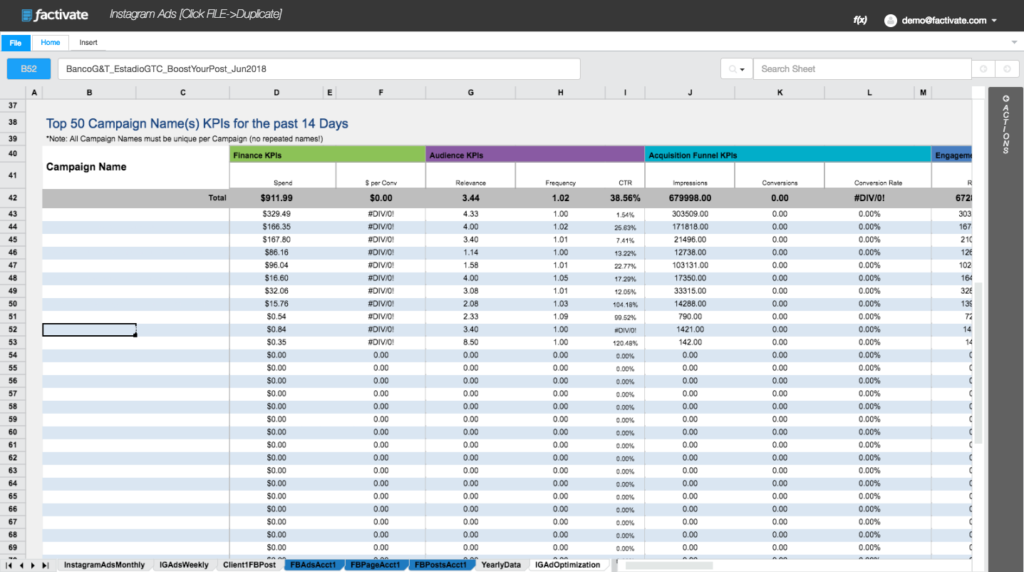
- You can view the number of Instagram ad campaign clicks, impressions, and conversions in the “Performance and Clicks” report from Business Manager. Or, you can also use the spreadsheet below to view the data in one place (you can see Impressions, Conversions, and Conversion rate under the Acquisition Funnel KPIs section)
- Before you take a look at other Instagram metrics, you should consider taking a look at the number of ad impressions and conversions (this is the case for whenever a campaign objective is focused on conversions)

- Conversion Rate
- One of the most important metrics to track in your Instagram ads is your conversion rate. A conversion rate indicates just how big a percentage of the ad viewers convert into traffic. It is calculated by dividing the number ad impressions with the number of conversions.
- Benchmarks:
- You should be doing your own benchmarking over time for this number as industry benchmarks can vary. In our case, the conversion rate varies over each quarter even though we track it per day, week, and week-0ver-week in this spreadsheet (see chart below Conversions).
- Cost per Conversion
- Your ads might be having great reach, impressions, and even click-through-rate, but if they don’t convert, you won’t be able to get any new customers. This is why your $ per conversion (or cost per conversion) is very important. It shows how much the actual conversion (and not the click or impression) cost you.
- TIP: We recommend that you establish a benchmark Cost per conversion (or target cost per conversion) every time you start a new campaign, define your audience, etc). This will help you stay focused on optimizing your campaigns).
That’s it for now. Keep an eye on these metrics using a reporting tool like the spreadsheet included and you’ll stay on top of your ads like a pro. Then all you need to do is experiment constantly within your benchmarks to achieve Instagram Ads nirvana. Feel free to take our Top Instagram Ads KPIs Spreadsheet to make you look really really good and make it yours or simply sign up for Factivate and have that report be completely automated for you.
Do you track any additional KPIs? Let us know by emailing us or writing in the comments below!

