
Work smarter with these 9 Ready-Made Spreadsheet Templates (And Our Top Tips to Make you Look Really Really Good)

Our core belief at Factivate is to help marketers shine through their creativity and not by forcing marketers to become data scientists. This is why our marketing spreadsheet templates have been so popular for our users; whether they’re used to help track your website performance, track social media metrics, and ultimately help you (awesome marketers) behave optimally without investing any time into reporting or complex analysis.
There are hundreds of spreadsheet templates out there that all claim to help you. Go ahead, do a Google search. I’ll wait until you come back. Finding the right one and then customizing it to your needs can be a time sink. This is why we’ve put together this article to help you.
To give you a hand with managing your marketing spreadsheets and save you a great deal of time (and MONEY), we’ve compiled a list of essential spreadsheets, templates, and KPI alerts that are handy for every marketer to have in their corner. Ready to get started?
9 Ready-made Marketing Spreadsheets to Boost Your Productivity and Make you an Optimal Marketer
For all of the spreadsheet templates linked below, you can see them publicly but you will need a Factivate subscription in order to connect them to your accounts (ie, Google or Facebook) and have them automatically import the data for you. Once you have your account, you can go to “FILE>Duplicate” to add the template to your account, then connect, and begin your journey to optimal marketer!
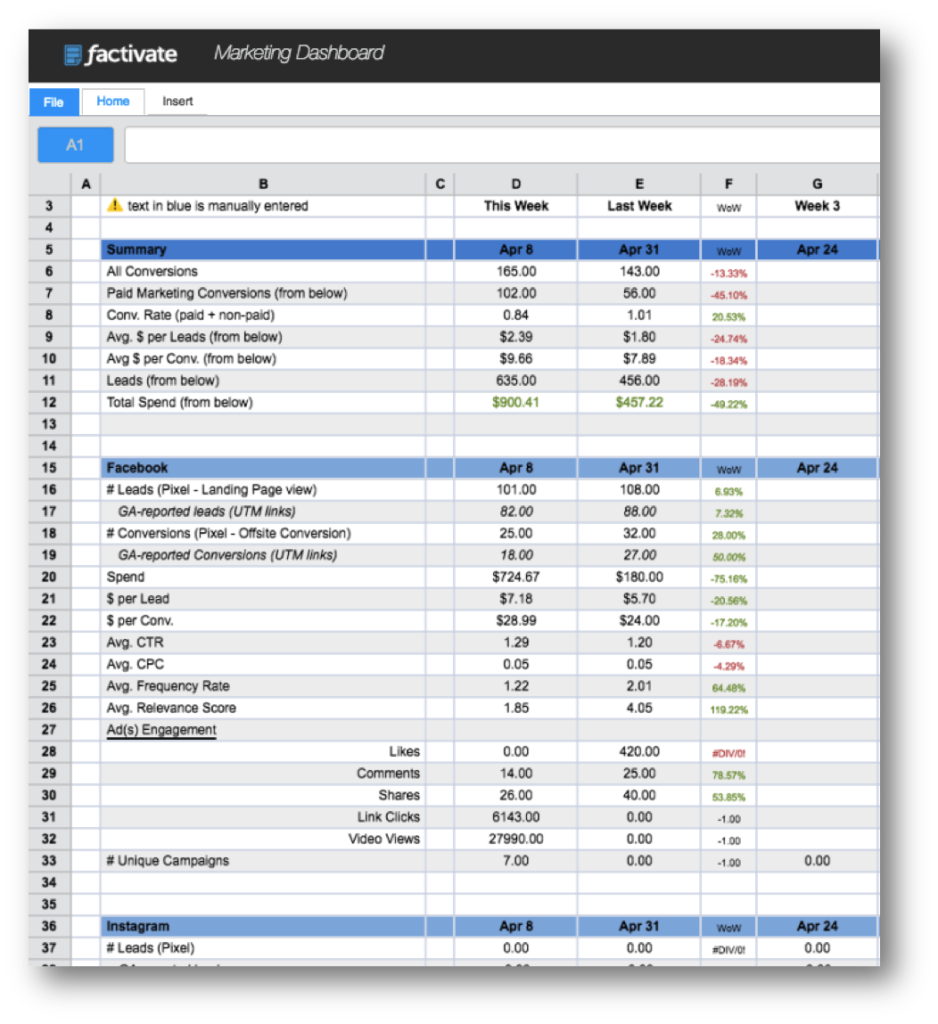
1. A bi-weekly Social Media Ads report
Optimize your Social Media Ads by automating your reports and KPI alerts.
View a copy of this marketing spreadsheet here >>
This social media report works by automatically pulling data from your Facebook Ads and Instagram Ads. The report will help you keep tabs on your engagement, top posts, ad targeting (relevance score), and much more.
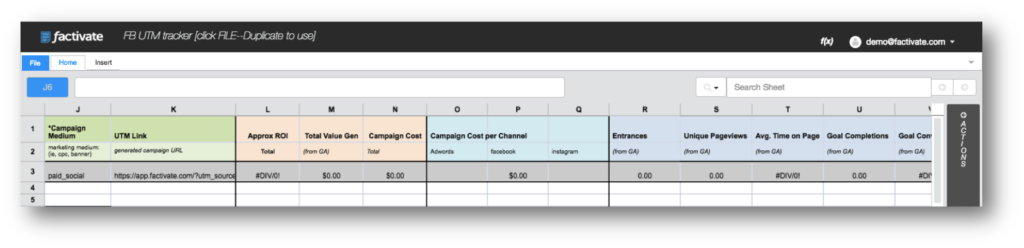
2. Campaign URL Builder and UTM Library tracker
See (and track) all of your paid campaigns from one place.
View a copy of this marketing spreadsheet here >>
This spreadsheet template can be used to add and manage all of your UTM links per ad from one place and track each UTM campaign’s results. Use it to:
- Establish rules for your marketing team when creating a UTM link.
- Maintain a database of all of your active links and read their performance.
- Automatically report on all UTM campaign links from all sources (ie, combine Facebook Spend with Google Analytics conversions to create a cost per conversion)
- Analyze traffic growth
- Analyze clicks per UTM link.
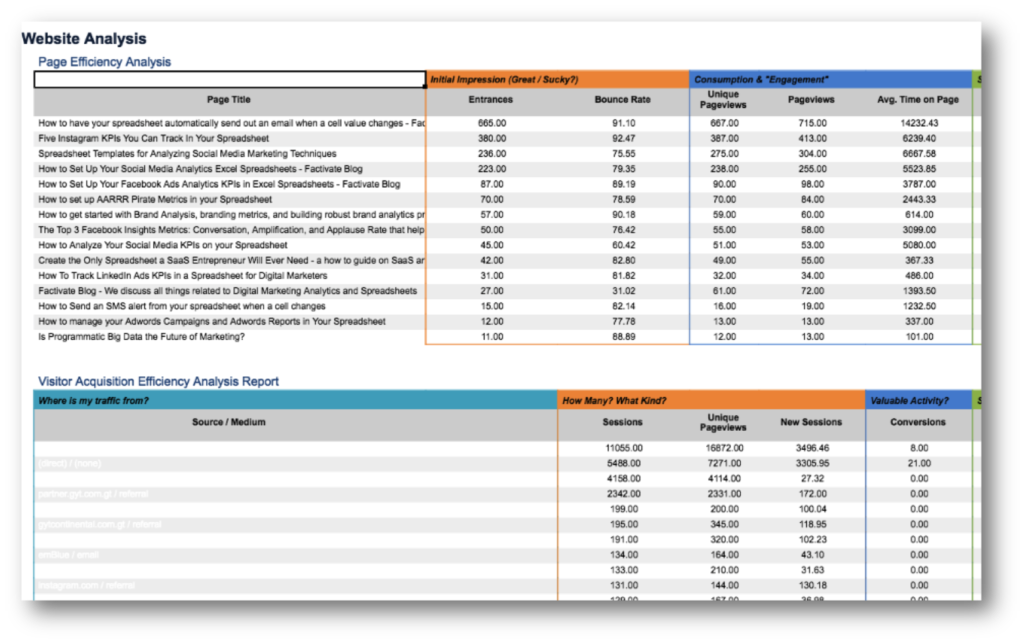
3. Web Optimization Spreadsheet
Know which pages or blog posts are generating the most traffic.
View a copy of this marketing spreadsheet here >>
This is one of our favorite spreadsheets in Factivate and I’m excited to share it with you. We based this report mainly on Avinash Kaushik’s recommendations on tracking Page efficiencies and visitor acquisition efficiencies. The web optimization spreadsheet enables us to keep an eye on the pages that are hitting our traffic goals, which ones are problematic, and which sources of data are converting at the best rates.
4. Social media ROI Dashboard and Report
See right away which social media posts are on track to hit your goals and which ones are taking off.
View a copy of this marketing spreadsheet here >>
How can you tell if a certain number of shares, comments, or likes are bringing your brand any return on your investment? It can be a bit of a puzzle to understand your social media results by looking inside the analytics platforms provided by your channels so we’ve measured economic value by understanding the conversation rate, applause rate, and amplification rates of our social media activities (see Ads analytics KPIs post, section 2 for am example of how we evaluate these using Instagram ads).
Once we have some historical understanding, we set benchmarks and baselines for our social media marketing using the above spreadsheet as a starting point.
Simply connect the spreadsheet to your Facebook account and you’ll be well on your way.
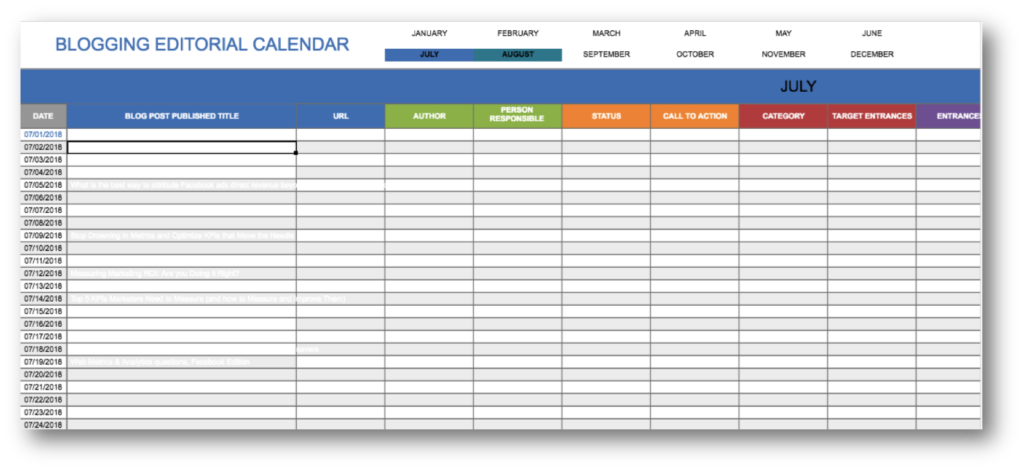
5. Blogging Editorial Planning Calendar and Tracker
Easily plan and track all of your blogging content in one place.
View a copy of this marketing spreadsheet here >>
Planning your content calendar while viewing the content results from the previous months can be a really good habit. Once you get into a good flow, you will gain a ton of value on identifying and creating engaging content.
Here are some of the things we track in the editorial calendar spreadsheet:
- Target Entrances
- Entrances
- Bounce Rate
- Unique Pageviews
- Average Time on Site
- CTA Clicks
6. Facebook Multiple AB Tests Tracker
Easily track and review your experiment results from Facebook and Google conversions.
![]()
View a copy of this marketing spreadsheet here >>
https://app.factivate.com/spreadsheets/865f70c2d7de48efba70a3b44a51624e/
We were grateful to partner with a premier digital agency in creating this Facebook AB test template. One of our favorite features: it includes a sheet that compares up to 5 different Ads from Facebook or Instagram with Facebook-specific KPIs and Website conversion data in one place. It even points out the potential discrepancies between the Facebook-reported conversions and the Google-reported conversions.
It takes about 2 minutes to set up tracking your 5 different experiments. We use this almost on a weekly basis.
7. Multiple (5+) Brands Campaign Planner, Dashboard, and KPI Tracker
Easily view your Social Media and Website data for multiple brands in one place for the optimal brand analytics.
![]()
View a copy of this marketing spreadsheet here >>
Aggregating information from multiple Social Media brands into one report can often be a cumbersome, error-prone process. This spreadsheet helps make reporting and tracking a breeze for marketers who need to manage more than 5 brands with different websites and different Facebook accounts. The template includes:
- A campaign planner where you can store all of your UTM links/parameters for all of the different brands. It includes GA-specific website performance metrics, cost performance metrics, and profitability metrics.
- A monthly dashboard that tracks your most important KPIs per brand from Spend to the web Unique Page views generated by your Social Media Ads.
- A budget planner per brand on a monthly basis that will ensure you’re never spending more than necessary.
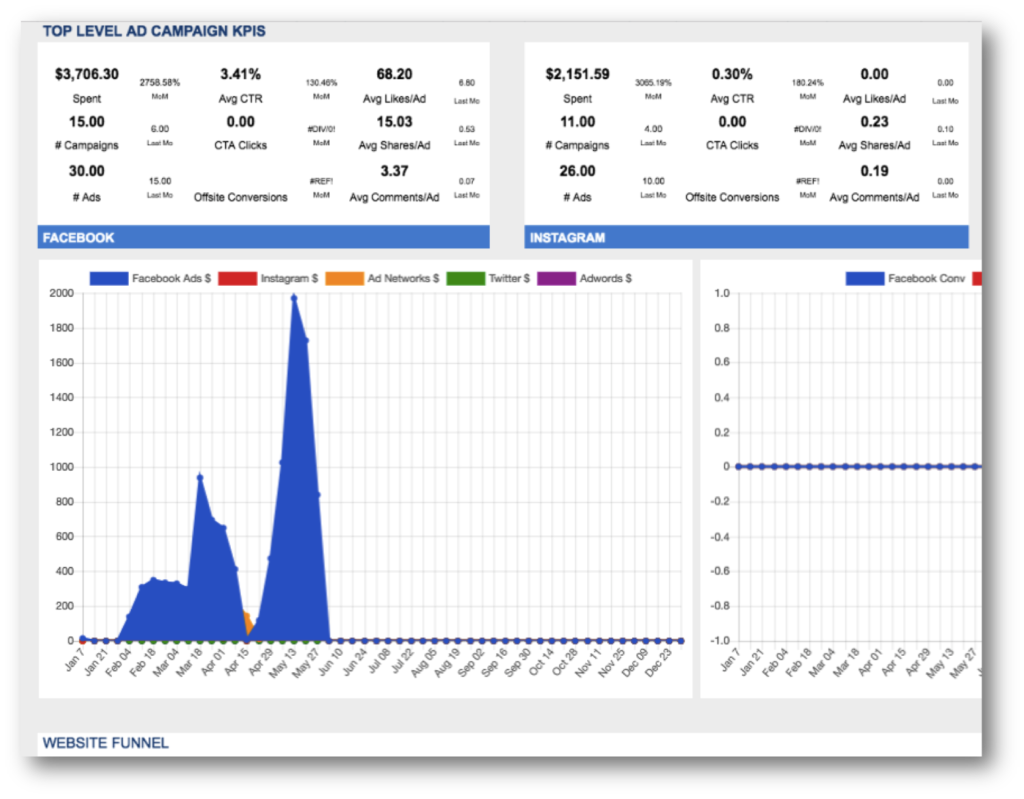
8. Social Media Micro-Ecosystem Reports for an Analyst, Manager, and Executive
Easily communicate your progress to each management layer within your organization.
The primary reason for this report is simple: you are unique. Your position is unique. Why would a report created for everyone work? This spreadsheet was built based on three unique perspectives who all look at your data differently.
- The first tab focuses on the analyst or analyst team who will look into this data all day long. In here, the analyst can view (at a detailed level) which ads performed best, what engagement there was, and the outcomes of your hard work.
- The second tab focuses on the manager who will likely look at this a few times a week. This is the person who will process data after the traffic shows up. They typically don’t care about the upfront stuff but they do care about what’s happening under their responsibility. Consequently, the report helps answer the question of whether he/she is spending money optimally to attract more users and ensuring that money (and lots of it) is being produced.
- The final tab focuses on the Executive or VP of Digital. The report has substantially fewer metrics with a focus on cost and productivity (HINT marketers: these are the two KPIs that they’ll use to praise you and get you and themselves a bonus).
The spreadsheet above pays off rich dividends by killing data pukes, focusing on what’s important, and creating one destination for everyone to go to, and for everyone to point to.
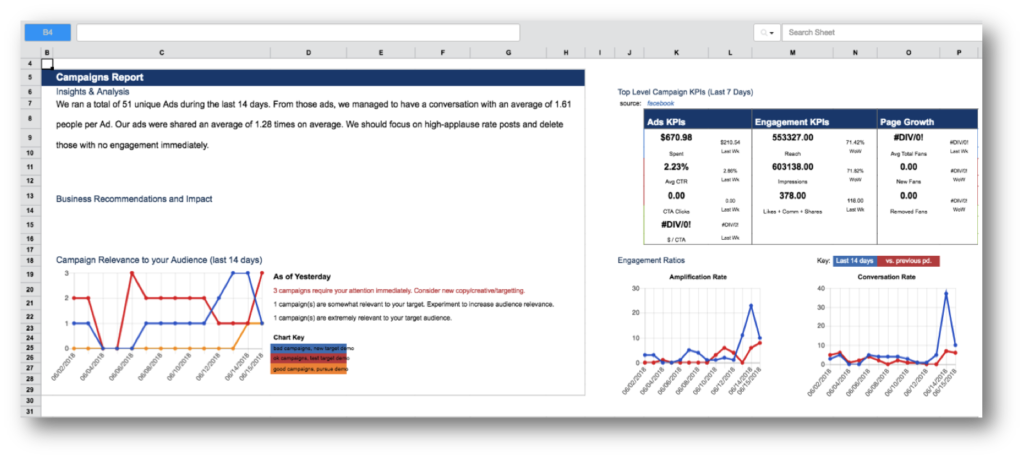
9. The Digital Agency Report for Clients
Easily share your results with your client from all of your Social Media campaigns and engagement results.
View a copy of this marketing spreadsheet here >>
This dashboard built by a premier digital agency focuses on breaking down your Facebook campaign results while also displaying your Google Analytics engagement and demographic data. KPIs in this spreadsheet include:
- Spend
- CTR
- Applause Rate (avg likes/ ad)
- Conversation Rate (avg comments / ad)
- Amplification Rate (avg shares / ad)
- and more
Now over to you: What are your favorite spreadsheets / templates?
I hope this list helps you become the optimal marketer I know you are. I would love to hear from you and ask you for your favorite spreadsheet hacks or templates. What KPIs do you focus on? Feel free to leave a comment below. I’m excited to join the conversation and learn from you too.