
How to Set Up Your Instagram Ads Analytics KPIs in Excel Spreadsheets
Instagram is a wonderful advertising platform! It’s so wonderful that it breaks my heart when people spend hundreds of thousands of dollars looking for likes and reach when they can get so so much more by being just a little better about their KPI tracking beyond Facebook’s own analytics platform. With that in mind, I wanted to share how you can set up your Instagram Ads Analytics KPIs in an Excel Spreadsheet.
How to Build your Instagram Spreadsheet
You have two options in following this how-to post. The first one is to use one the Instagram Ads KPI spreadsheet template we created using Factivate (www.factivate.com).
You can find the automated spreadsheet template we reference in this article by going here: https://app.factivate.com/spreadsheets/b155502b067940358bc50887c74fbbff
To use it, you will need to log into your Facebook/Instagram account and then you will have the spreadsheet template automatically update itself so that you can focus on optimization. Then, all you have to do is showcase how brilliant you are.
If you want to be more difficult (because let’s face it, people can be stubborn), then I’ll explain how to do this the old manual way in Excel. Note that you will be required to update your spreadsheet continuously to keep the report relevant.
Why do I need an Instagram Ads Analytics Spreadsheet?
At the most macro level, we participate on Instagram to engage with people via our brand pages (not to directly drive sales). If we do things correctly, then maybe some of these individuals will remember our brand name and products when it’s time to make a purchase. As a result, when you are building a Instagram spreadsheet, note that it is likely that you will spend most of your attention and focus on what is happening on Instagram rather than driving sales. It is very very important that you
- Understand this
- Get a shared understanding with your team on why you are using Instagram
- Then understand how the spreadsheet measures ROI.
The reasons above highlight exactly why you need an Instagram Ads Analytics spreadsheet. This is a logic that Facebook does not present to you, yet your team will require you to think about and your spreadsheet will be made to prove that the activity you generate on Instagram is VALUABLE, delivers business value, and helps produce profits.
Let’s get started!
Step 1: Build out your tabs
Think about your reporting and monitoring as separate tabs. One will be made for your team to understand what is happening (much more focused on ROI and business value), the later will be made for you to focus on optimization of active campaigns. You will need to create two tabs:
- Executive Dashboard: Shared with client and aggregates campaign kpis.
- WeeklyReport – this will be your internal report to view your company’s paid Instagram activities.
Step 2: Setting up the Executive Dashboard
Let’s jump into the metrics conversation and consider that, if you strip everything away, Instagram (as designed), is a quest for Likes. It is what you are asked to hunt for at every turn by Facebook/Instagram and even your clients. However, in the end, Likes don’t matter for two reasons:
- Do all Likes you spent blood, sweat, and tears getting cause any activity of value on your Instagram presence?
- And (more importantly, do any of those likes cause any value to your actual business beyond an Instagram presence.
For each of your efforts, we are going to look at #1 and #2 (or both) depending on our goals.
I spent some time talking about Likes because it is the single biggest indicator to me when I review a client dashboard whether the company/agency actually knows how to measure their Instagram ROIs. Whenever I see that, I immediately ask whether they can measure value from likes and they cannot.
Simply put…Do. Not. Measure. Likes.
I will hate you and take away all of your data credentials…
Too strong?
No matter what the client wishes to see in their dashboard, do not showcase that metric (notice I don’t call it a KPI!). Declaring success based on measuring Likes in aggregate is like saying ran a successful campaign because you got a lot of visits to your site. Except, Likes are actually worse. Because if I press Like, I might never come back, I might never read anything related to your brand, never engage with you, or never remember you are a company. Maybe I just thought your work with filters was good and then moved on…
Think about likes as a way to show potential audience and nothing more.
Okay, venting aside. We said we’e lock into building a dashboard…
First, for your Instagram Dashboard, you will want to measure your Conversation, Amplification, and Applause Rate trends (from my top Insights metrics post)
You will want to share with your team (as a starting point) 1) when we pushed an Instagram ad, does anyone actually engage with us via typing on their keyboard and adding to the discussion? When we push our ad, does anyone amplify our contribution so that it is seen by people who don’t know about us? When we post on Instagram, which content is loved by our followers/fans/friends (so that we can stop pushing loser stuff)?
With these ratios in mind, you will measure the trends over time and you’ll be able to show your team that you have a gazillion Likes, you managed to have a conversation with 10 people on average per post, and your post has been shared an average of 10 times each so you will focus on high-applause posts. (Rather than saying, we got a gazillion likes, we’re awesome…we shift the conversation so that Likes are used to identify high-value content via user behavior instead).
So, now that I’ve vented, what does this dashboard begin to look like?
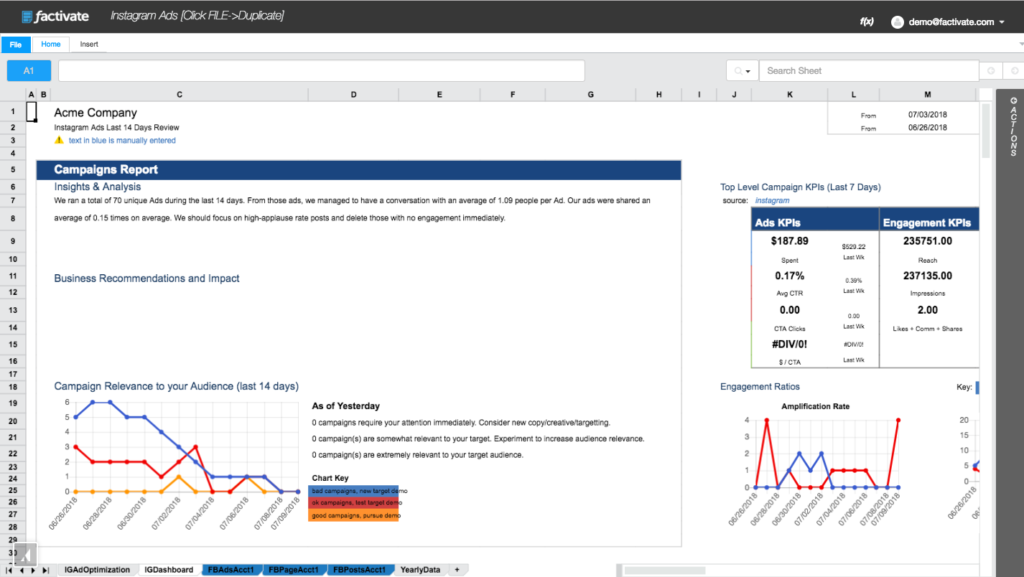
Notice that the dashboard is built to provide context to our team, not just a data puke (like all other dashboard tools out there). The beauty of this spreadsheet is that it allows us to enter text to help our team/client understand our efforts. With this information, our team’s efforts are spent reading the text first rather than going directly into the numbers which they might or might not understand.
As I mentioned, context is key in this dashboard. I’m using some pre-configured text and formula references to summarize the number of unique ads published and talk about the conversation and amplification rates in a way most people will understand. If I want to view my trends on Amplification, conversation, rand applause rates, I also added these graphs under the Engagement Ratios section. This way, our reader will be able to compare our performance across two different periods.
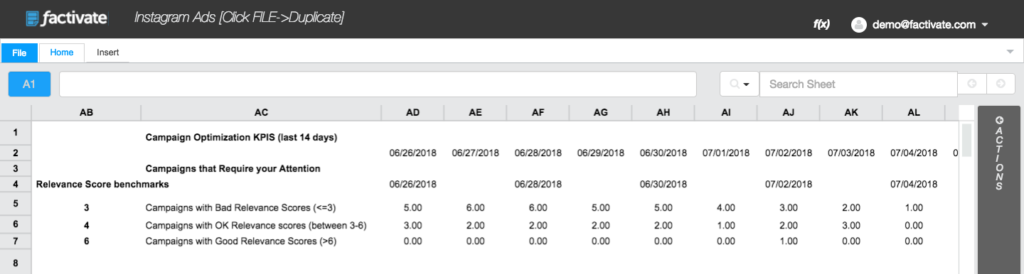
After discovering how many people are engaging with me on average (not on aggregate), I move on to trying to understand why this is the case. Maybe I’m not targeting the right people? Maybe my copy is great? This is why Relevance Score is included in the Campaign Reports section.
I’ve benchmarked a good (>6) , ok (between 4 and 6), and bad (<3)relevance score in this spreadsheet and laid out my relevance score averages per day. The graph then pulls from my data here:
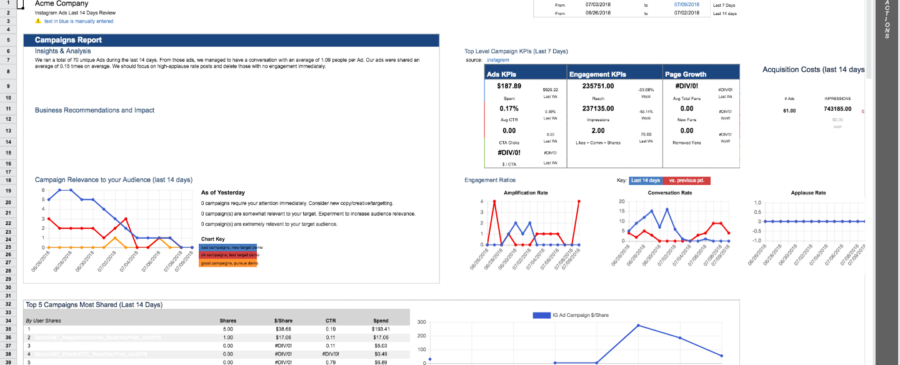
Finally, I display top level KPIs and top campaign KPIs to explain my campaign recommendations and business impact within the campaign report. I finish the dashboard up with the following KPIs
- Top 5 Campaigns most shared
- Top 5 Campaigns most likes
- Top 5 Campaigns most commented on
- Spend
- CTR
- CTA Clicks
- $ per CTA
- Reach
- Impressions
- Social Engagement
- Page Growth
- Acquisition Funnel (impressions, engagement, clicks)
The final spreadsheet/dashboard then looks like the image below:
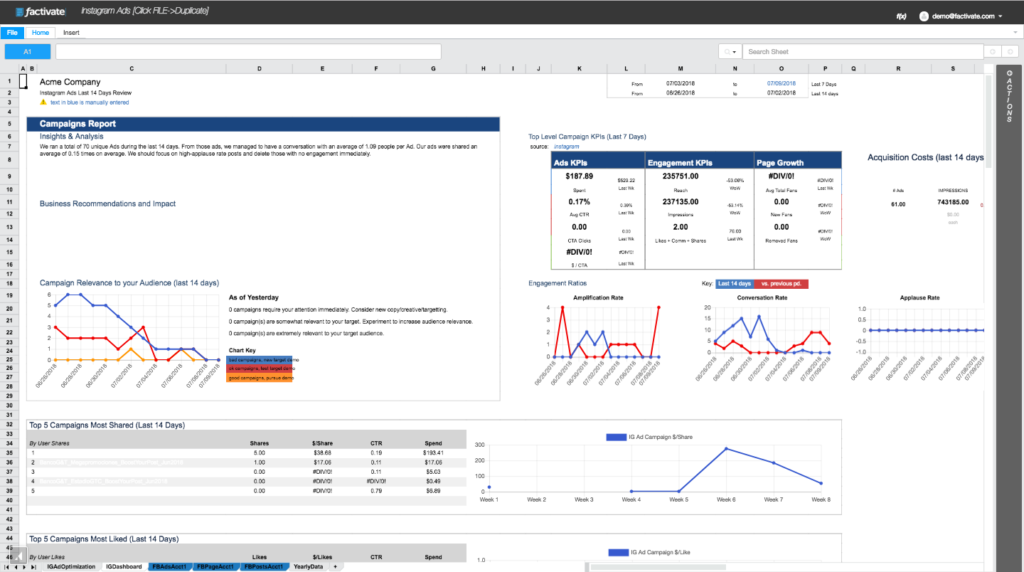
Now, when you look at the entire dashboard, you will see your campaign performance and recommendations in context and not as a data puke. Isn’t it beautiful! Every time I open something like this up, it just makes me grin from ear to ear.
Best of all, you can apply these same principles to Facebook Ads as well.
Step 3: Setting up your Weekly (or week-over-week) Analysis / Optimization Tab
You should be optimizing your campaigns based on your campaign goals so this tab should be structured a little different. That being said, I’ve found that you can have a healthy view of all of your campaigns if you follow this format:
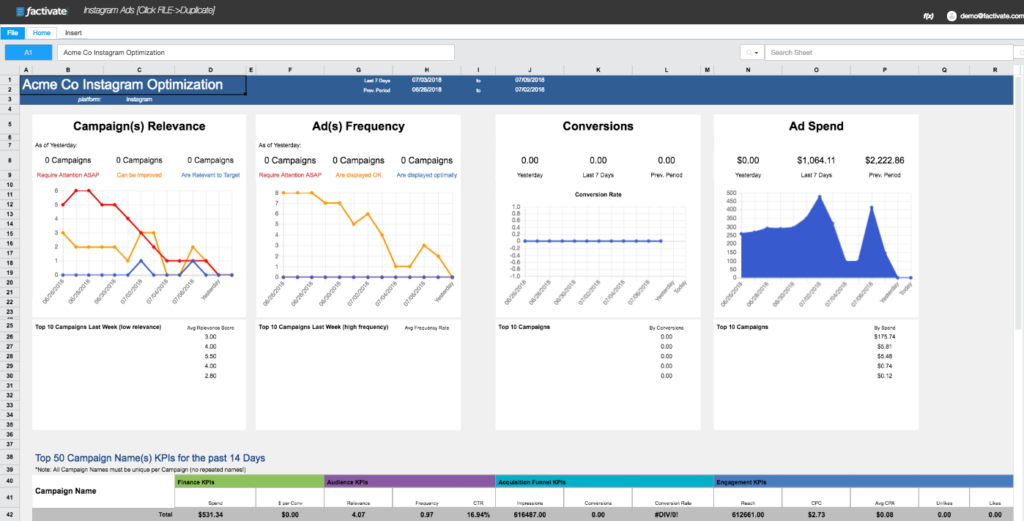
First, I start off with tracking whether my ads/copy/creative are being targeted correctly and whether my frequency is staying within the parameters I’m comfortable with. In the screenshot above (with some fake data), it’s clear it needs some work.
In the case of this tab, I’m tracking conversions for an ecommerce store so I added a section for conversion tracking. Finally, I want to track spend to make sure I’m staying on budget.
Below those four charts is what I’d like to call the reporting aspect of campaign analysis. I’m adding all of my campaigns with their performance KPIs. These include:
- Spend
- $ per Conv.
- Relevance
- Frequency
- CTR
- Impressions
- Conversions
- Conversion Rate
- Reach
- CPC
- Avg CPA
- Unlikes
- Likes
- $ per Like
- Shares
- $ per Share
- Comment
- $ per Comment
- Mentions
- Photo Views
- Total Video Views
- $ per Video
Note that this information will be displayed per campaign and (again depending on your objectives), you might be interested in one KPI over the other. This is why this comprehensive list of KPIs per campaign is so useful. You can choose to hide the columns you’re not currently using or leave it all out there, it’s up to you.
Making your entire Excel Spreadsheet work beautifully!
Once you’ve set up your Instagram Ads spreadsheet infrastructure, it’s time to analyze and track your data. Whether you do it by campaign, or on an aggregate basis, be sure to pay close attention to the KPIs that meet your objectives. Again, focus on your applause, conversation, and amplification rates to view your engagement ratios on a per post level. Not doing so, can severely affect how you measure success of your campaign’s performance.
Conclusion
You don’t need to be a data expert to build your Instagram Ads excel spreadsheet. Just a little elbow grease and a rudimentary understanding of leveraging Instagram’s original purpose will go a long way. Remember to keep iterating and trying different ads to ensure relevance to your audience. If you choose to build an Excel model for Instagram, try to update it at least once a day. Not doing so can really affect your campaign outcomes! If, on the other hand, you decide to be smart and use Factivate’s template, just focus on your data and stop importing your information manually!
About Factivate
Factivate is a software company part of the Google for Entrepreneurs community in Durham, NC. Factivate provides business users with a cloud-based data analytics platform that can sync with different online tools to create automated, real-time spreadsheet reports and web dashboards with just-in-time business reactions. Consequently, Factivate provides the most accurate data analysis for digital marketers and advertisers in order to increase their ROI and profitability.